개요
Prometheus 는 오픈소스 모니터링 솔루션이다. (https://prometheus.io/)
크게 Prometheus 서버와, 메트릭 정보를 export할 export node로 구성이 되어 있다
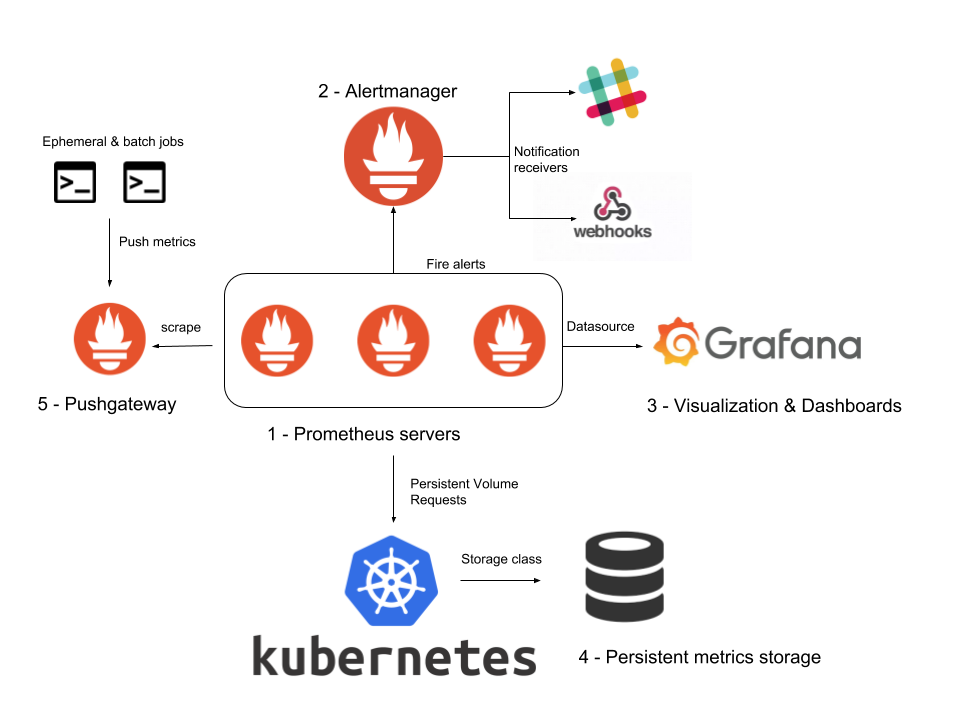
구조가 좀 일반적인 모니터링 시스템과는 다르다는걸 느낄수가 있는데, 원래는 대부분의 솔루션이 메트릭을 수집할 때 메트릭이 발생한 서버에서 중앙 서버로 데이터를 전송해주는 구조로(push) 되어 있지만, 프로메테우스 같은 경우는 신기하게도 중앙서버(prometheus server)에서 메트릭을 polling 해서 가져가도록 구성이 되어 있다.
장점
이 솔루션을 쓰게 되면 얻을 수 있는 장점은, 아무래도 pull 방식의 구조를 채택함으로써 모든 메트릭에 대한 데이터를 중앙 서버로 보내지 않아도 된다는 점이다. 대부분의 모니터링 시스템 구조는 push방식으로 메트릭이 발생하면 해당 메트릭을 서버로 보내는 방식을 채택하고 있는데, 만약 부하가 높은 상황에서 그런 메트릭들을 수집하기 위해 전송하는 부분이 생긴다면? 부하와 더불어서 실제 어플리케이션에 문제를 유발할 수 있는 fail point가 생기는 것이다
Prometheus의 특성 상, 모든 데이터를 수집하지 않고 일정 주기(default 15s)로 발생하는 메트릭을 수집하여 추이나 모니터링을 어플리케이션에 무리 없이 하기 때문에 이러한 부분에서 매력적인 솔루션이라고 말할 수 있다.
또한 현재 Prometheus를 사용하고 있는 Vendor와 open-source들이 상당히 많다. 구조가 복잡하지 않고 간단하기 때문에 특정 솔루션에 대한 export를 하는 것이 어렵지 않다. 특히 Kubernetes와 Docker환경에서의 서비스의 메트릭을 수집하고 분석하는 대에 집중적으로 많이 사용이 되고 있다.
단점
Scale-out이 안된다(정확히 말하자면 억지로 되지만, 이것은 사실상 clustering이 아니라고 본다) 문서에 적혀있기를 Prometheus를 여러대에 구성해서 사용하려면 Prometheus에 Prometheus를 연결해서.. Hierarchy 구조를 만들어서 사용을 하면 된다 라고 하는데! 세상에 너무 지저분한 구조인 것 같다.
대부분 Clustering이라 함은.. Host를 여러대 두고 gossip을 통해 서로를 discovery 하고, 데이터를 sharding 및 replication을 해서 특정 노드가 죽어도 H/A(High Availability)를 보장해주는게 되어야 하는데 Prometheus 같은 경우는 그런 고가용성을 지원한다는 개념보다는 간단한 구조로 손쉽게 사용을 할 수 있다에 목적이 있는 것 같다.
또한, 위의 장점이 또 단점이 될 수 있는 부분인데 모든 메트릭을 전송하지 않기 때문에 사실상 "추이"를 보는데는 좋지만 APM(Application Performance Monitoring)과 같이 발생한 모든 로그를 추적하고 문제가 발생했을 때 이를 검색해서 어떤 일이 있었는지의 원인을 밝히고자 했을때는 적합하지 않은 솔루션이다.
정리
따라서 위의 장점만 가지고도 서비스 모니터링에 부합하는지를 잘 체크를 해서 도입을 해야할 필요성이 있다. 장/단점이 확실한 솔루션이다보니 push방식의 비슷한 솔루션들에 비해서는 모호한 부분은 없는 것 같다고 생각이 된다.
서버 내부 모듈
Retrival
메트릭을 수집할 대상 서버에 접근해서(HTTP) 메트릭을 가져오거나, 아니면 Pushgateway를 통해서 접근할 수 없는 곳에 있는 데이터(inner server, firewall 내부의 metric 등)를 가져오는 등의 역할을 하게 된다
Pushgateway는 쉽게말해 Proxy Forwarding을 해서 접근할 수 없는 곳에 데이터가 존재하는 경우 이때 사용할 수 있는 대안이라고 보면 된다. 사내망에 데이터가 있어서 외부에서 scrape를 하고싶어도 접근이 안되는 경우 말이다. 아무래도 메트릭 발생 서버 -> 메트릭 집계 서버 가 아닌 메트릭 집계서버가 메트릭 발생 서버에 직접 접근을 해서 데이터를 가져가기 때문에 존재하는 개념인 듯 하다.
TSDB(Time-series Database)
이렇게 가져온 데이터를 저장하고, 시간의 흐름에 따라 조회를 할 수 있어야 하므로 시-계열 데이터(time-series) 를 저장할 수 있는 저장소가 prometheus 내부에 구현이 되어 있다.
데이터를 저장하는 방법은 Local Storage, Remote Storage를 이용하는 방법 두 가지가 존재한다. 대부분 Local Storage를 쓰는걸로 default로 사용하겠지만 필요에 따라서 원격지에 있는 서버에 데이터를 저장해서 사용을 한다고 한다
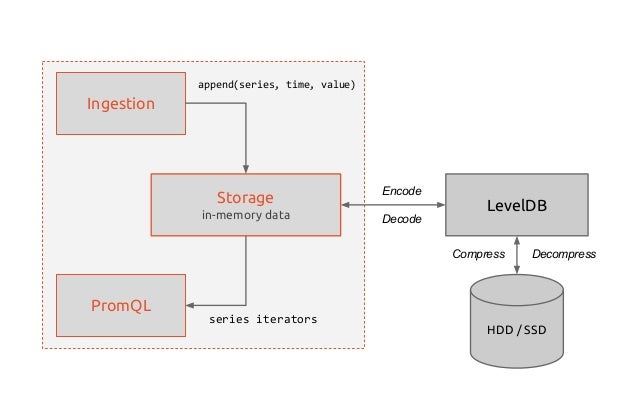
내부 저장소는 Google에서 만든 Level DB를 사용하는걸로 보인다 light-weight의 Key-value 저장소이며 전반적으로 뛰어난 성능을 보이기에 여러군데서 차용해서 쓰는것 같다.(프로메테우스도)
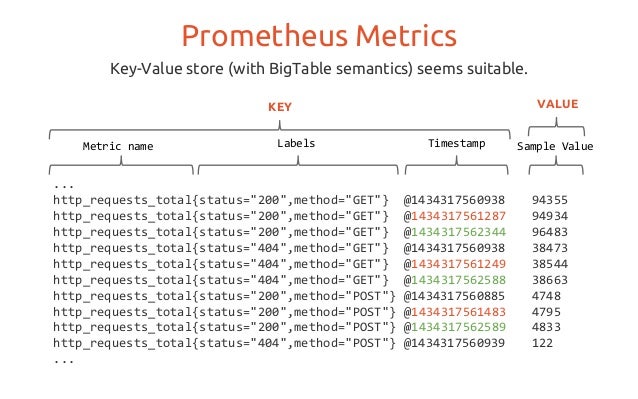
프로메테우스의 메트릭은 위와 같이 수집이 되는데
메트릭명{필드1=값, 필드2=값} 샘플링데이터실제로 timestamp값은 프로메테우스 서버 내부에서 저장될 때 같이 넣게 되고 export하는 부분에서는 메트릭명-샘플링데이터와 같은 형태로 보여지게 된다.
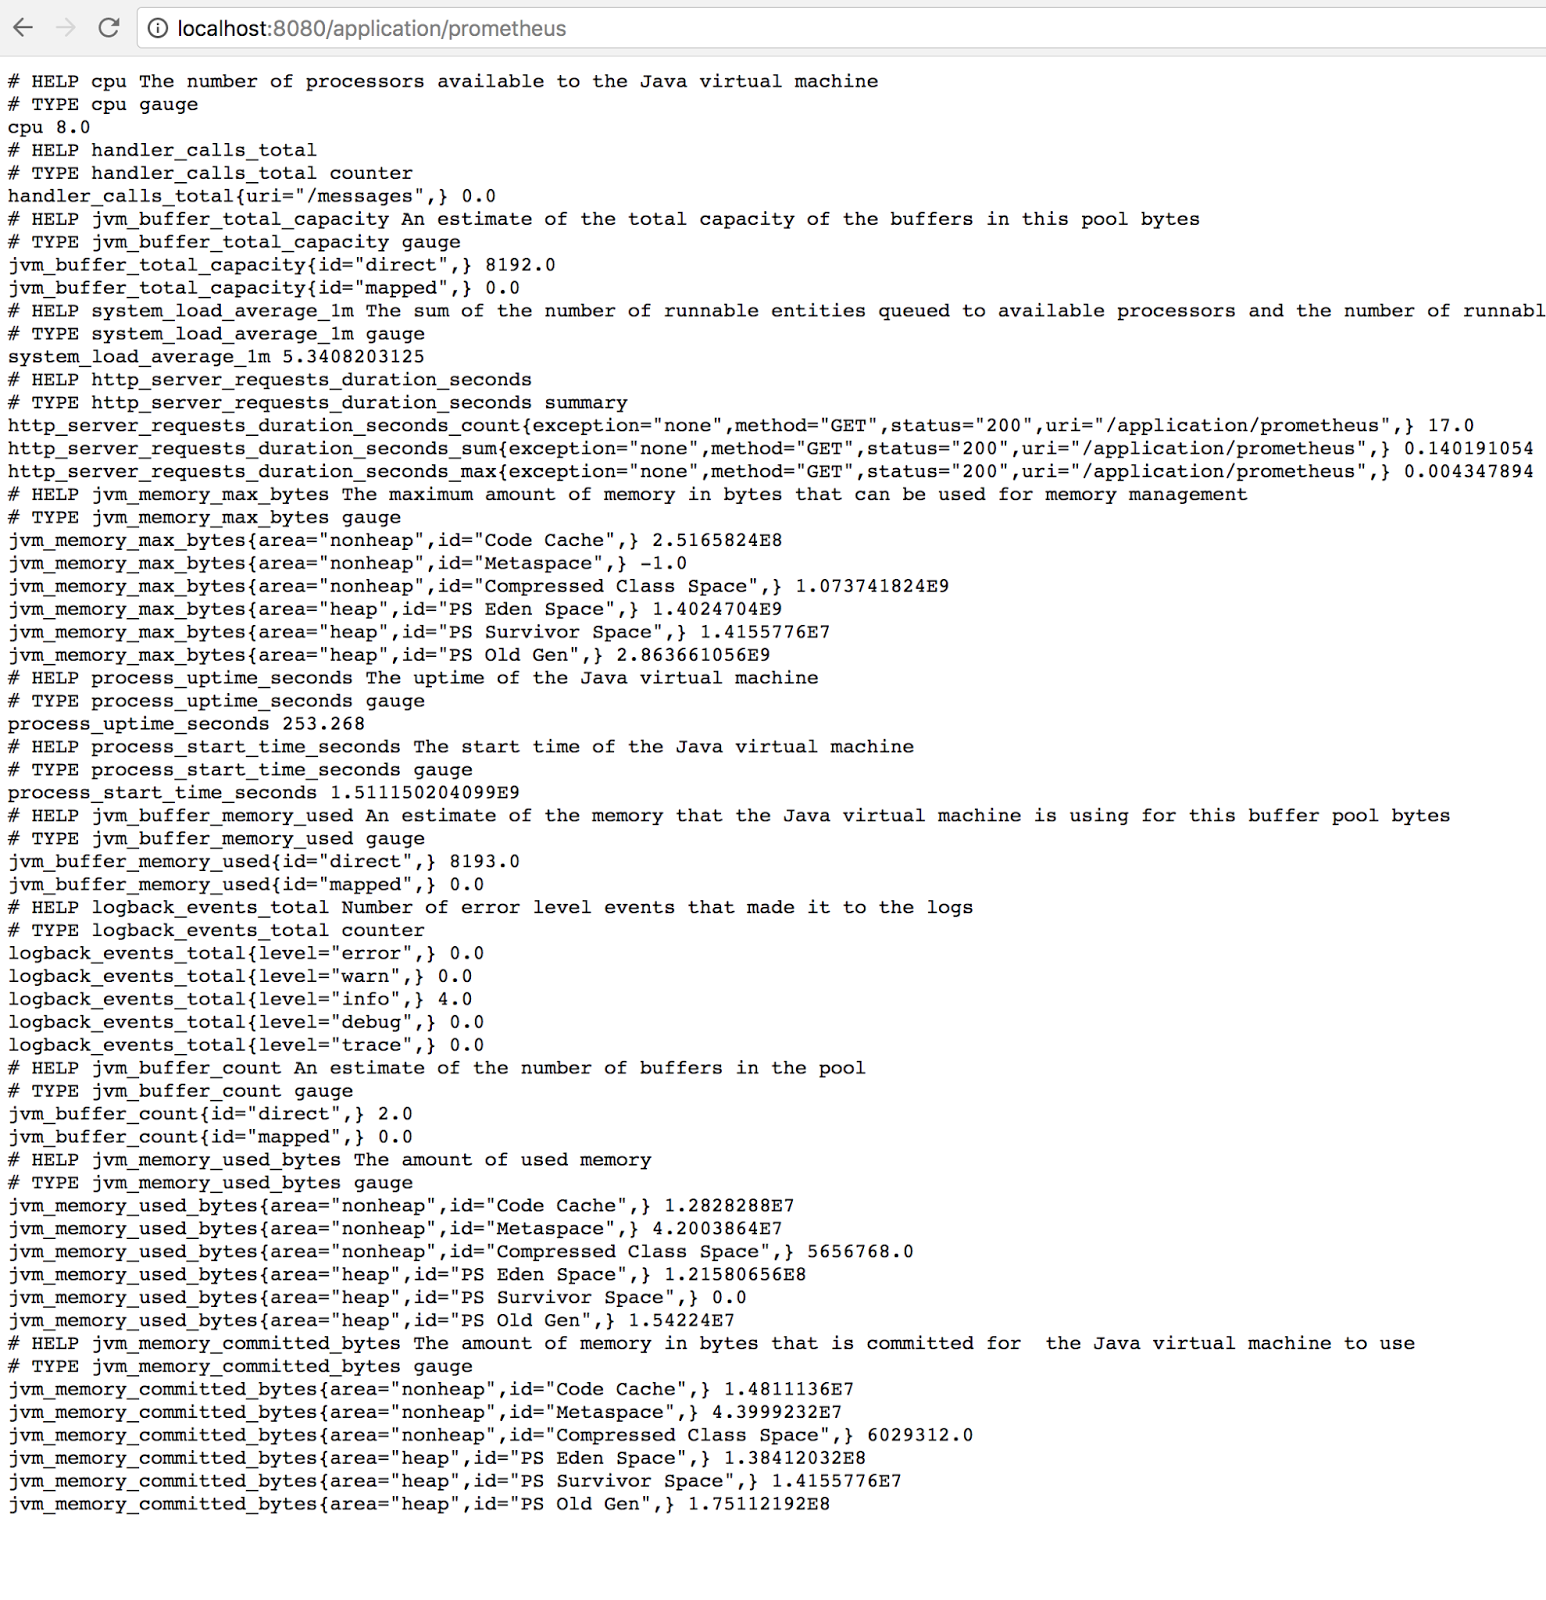
이게 Spring boot에 Prometheus export 라이브러리를 붙인 모습인데, 보다시피 많은수의 메트릭이 발생을 하게 되고, 이를 text/html 방식으로 특정 url(대부분 /metrics)로 export를 해두게 되면, prometheus 서버가 이를 긁어가서 데이터를 저장하는 구조이다.
HTTP Server
prometheus에 저장된 데이터를 조회하기 위해서는 내부적으로 HTTP 서버가 필요하다. 따라서 prometheus는 데이터를 가져가기 위한 프로토콜로 HTTP REST API를 제공하고, 직접 API를 통해 데이터를 가져가던지, Web UI 대시보드에서 데이터를 조회한다던지, Grafana를 통해 더욱 자세하고 깔끔한 데이터 시각화를 할 수 있다
Web UI
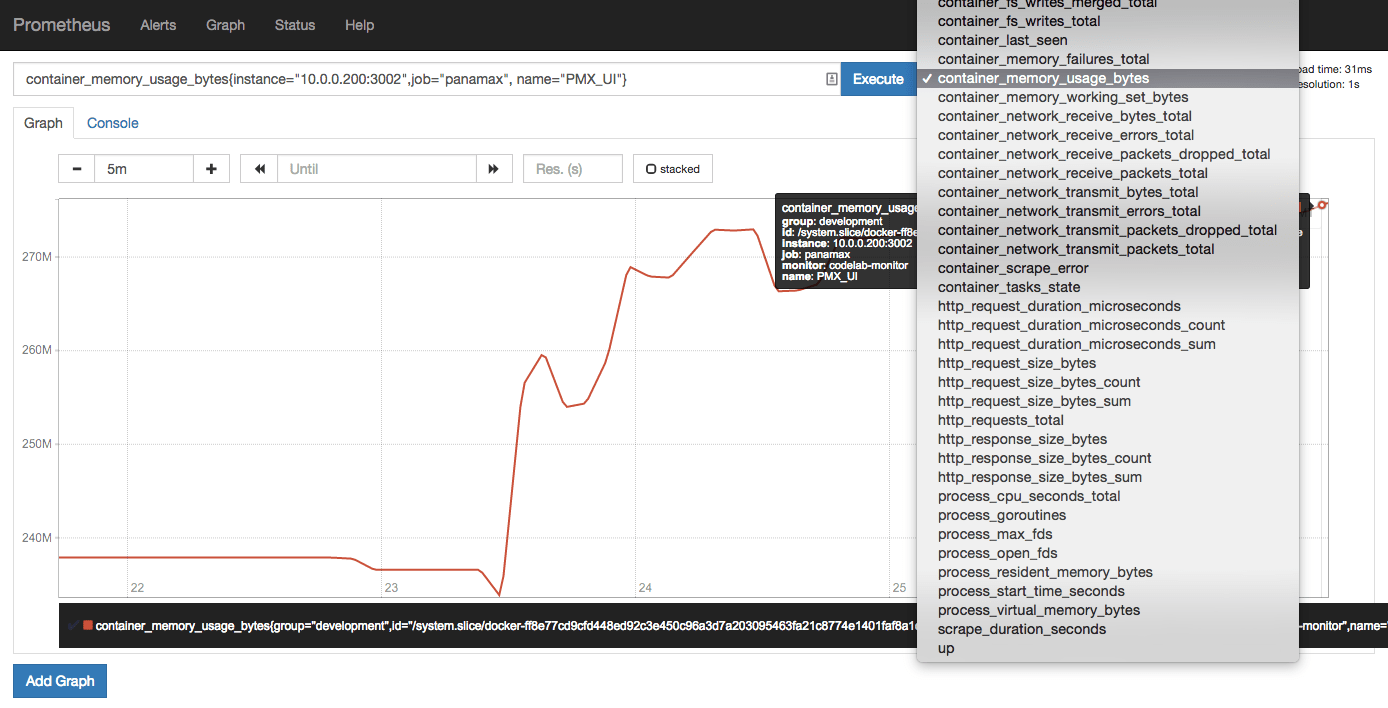
원래는 시각화를 위한 툴을 붙여서 보는게 더 좋지만, 그렇게 하지 않아도 기본적으로 제공하는 Dashboard가 있다.

위와 같이 Bootstrap으로 작성된듯한 투박한 대시보드가 제공이 되고, 간단하게 보고싶은 메트릭에 대한 그래프를 볼 수 있는 정도이다. 한 대시보드에 여러개의 메트릭의 추이를 보고싶다던지, 다른 그래프 형식으로 보고싶다던지 하는 것들은 지원이 되지 않으며 이는 Grafana를 통해 시각화가 가능하니 그쪽을 보도록 하자.
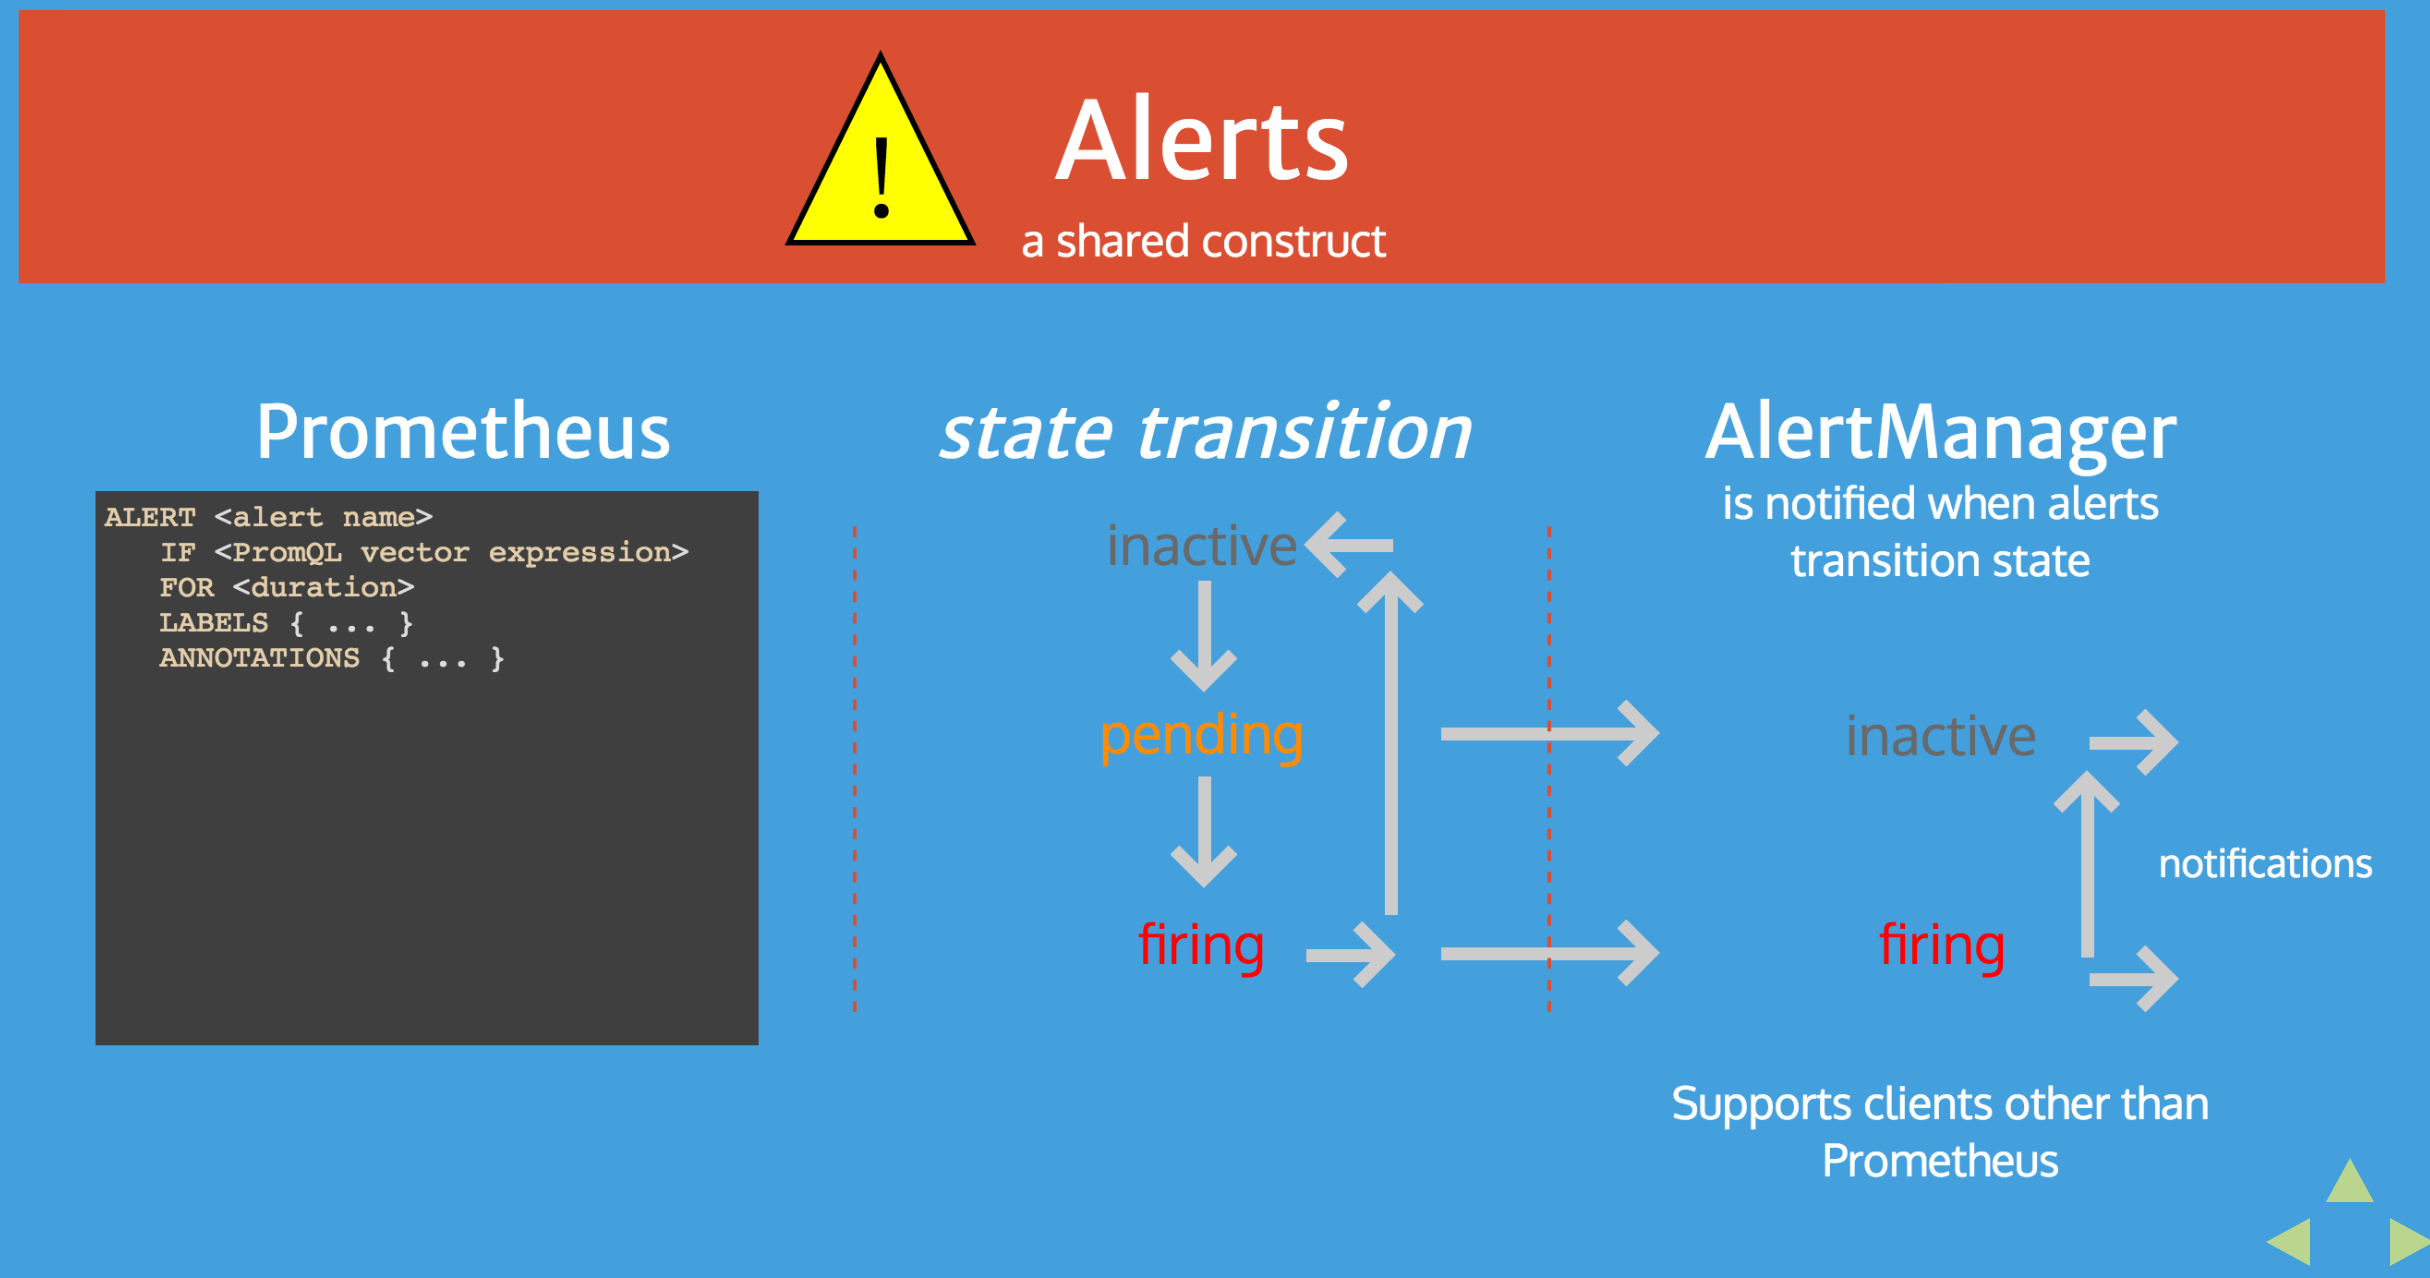
Alert Manager
모니터링 시스템이니, 문제가 발생하면 이를 알람으로 보내주는 역할도 있어야한다. Alertmanager는 Prometheus에서 문제가 발생했다고 생각되는 시점에 slack, hipchat 등을 통해 알람을 보내준다.
알람을 거는 기준은 Rule을 작성해서 load시키는 방식으로 동작하는데
expr: job:request_latency_seconds:mean5m{job="myjob"} > 0.5와 같이 expression을 작성하는 것으로 알람을 전송할 수 있다. 특정 메트릭의 값이 어느정도 선(threshold)을 넘는다거나, 낮아진다거나 하는 메트릭을 보고 판단을 할 수 있다.
다만, 이 또한 Grafana를 사용하게 된다면 Grafana에서도 동일하게 알람매니저를 제공을 하고 있는데, 아무래도 Grafana쪽이 사용하기 더 쉽고 직관적이기 때문에 이걸 직접 사용할까는 싶지만, 그래도 expression을 이용해서 더 복잡한 조건을 걸어서 알람을 노티해주는 방식이 있다는건 좋다.
Prometheus Server 설치
Installation
일단 client를 만져보기 전에 prometheus 서버를 설치를 해보도록 하자.
다운로드는 https://prometheus.io/download/#prometheus 에서 할 수 있다
prometheus 서버 말고도 각종 exporter가 있다(node js, alertmanager 등).. 여기서는 prometheus server만 받아서 맞는 운영체제 버전으로 받자
본인은 odroid의 armv7을 사용하고 있어서 해당 바이너리로 받게 되었고,
wget https://github.com/prometheus/prometheus/releases/download/v2.5.0/prometheus-2.5.0.linux-armv7.tar.gz
tar xvfz prometheus-2.5.0.linux-armv7.tar.gz
cd prometheus-2.5.0.linux-armv7
./prometheus
로 바로 실행을 할 수 있다. 다만 지금은 서버가 뜨긴 하지만 아무런 메트릭을 수집하지 않고있다. 이는 prometheus.yml에서 scape를 할 target을 지정하지 않았기 때문이다. 지금은 단순히 9090포트로 접근을 해보면 Prometheus의 대시보드를 볼 수 있을것이다
대시보드에서 무언가를 보기 위해서는 일단 prometheus.yml 의 내용을 보도록 하자
prometheus.yml
# my global config
global:
  scrape_interval:     15s # Set the scrape interval to every 15 seconds. Default is every 1 minute.
  evaluation_interval: 15s # Evaluate rules every 15 seconds. The default is every 1 minute.
  # scrape_timeout is set to the global default (10s).

# Alertmanager configuration
alerting:
  alertmanagers:
  - static_configs:
    - targets:
      # - alertmanager:9093

# Load rules once and periodically evaluate them according to the global 'evaluation_interval'.
rule_files:
  # - "first_rules.yml"
  # - "second_rules.yml"

# A scrape configuration containing exactly one endpoint to scrape:
# Here it's Prometheus itself.
scrape_configs:
  # The job name is added as a label `job=<job_name>` to any timeseries scraped from this config.
  - job_name: 'prometheus'

    # metrics_path defaults to '/metrics'
    # scheme defaults to 'http'.

    static_configs:
    - targets: ['localhost:9090']
설정이 다른 모니터링 서비스들에 비해서는 매우 간단한 편이다. (모든 설정이 간편한건 아니다. default로 설정 되어있는 config가 간단해서 그렇지, 실제로 모든 config의 field를 보면 상당히 양이 많다. 자세한건 https://prometheus.io/docs/prometheus/latest/configuration/configuration/)
config 설명
- global.scrape_interval : 몇 초 단위로 메트릭을 수집할 지를 결정(15초로 기본으로 되어 있는데, 이를 수정하여 1초단위로 수집을 할 지.. 10초 단위로 수집할지.. 1분 단위로 수집할지를 결정할 수 있다)
- global.evaluation_interval : 이건 alerting rule을 어느 주기로 evaluate를 할 것인지에 대한 설정이다. evaluate를 하게되면 그 결과를 바탕으로 (inactive, pending, firing) 의 세 state로 구분이 되고 그 상태를 기반으로 alertmanager에서 알람을 발송할 지 안할지를 결정할 수 있다
- alertmanager의 rule은 위에서 언급한대로 expression을 사용해서 설정을 할 수 있다
- alerting : alertmanager의 target port를 지정할 수 있다. prometheus를 실행하면 alertmanager가 자동으로 같이 뜨는게 아니라, alertmanager를 download해서 같이 구동을 시켜줘야 한다
- rule_files : expression으로 구성된 rule file의 path를 지정해준다. 복수개의 파일을 지정할 수 있다
- scrape_config : 이부분이 중요하다.
- job_name : 메트릭을 수집해서 구분을 할 네이밍을 지정
- static_configs.targets : 실제 메트릭을 수집할 서버의 주소를 지정한다. 리스트로 구성이 되어 있으며 여러개의 호스트를 지정할 수 있다
간단하게 static_configs의 target만 고쳐서 prometheus를 띄워보도록 하자
- targets: ['192.168.0.3:9090']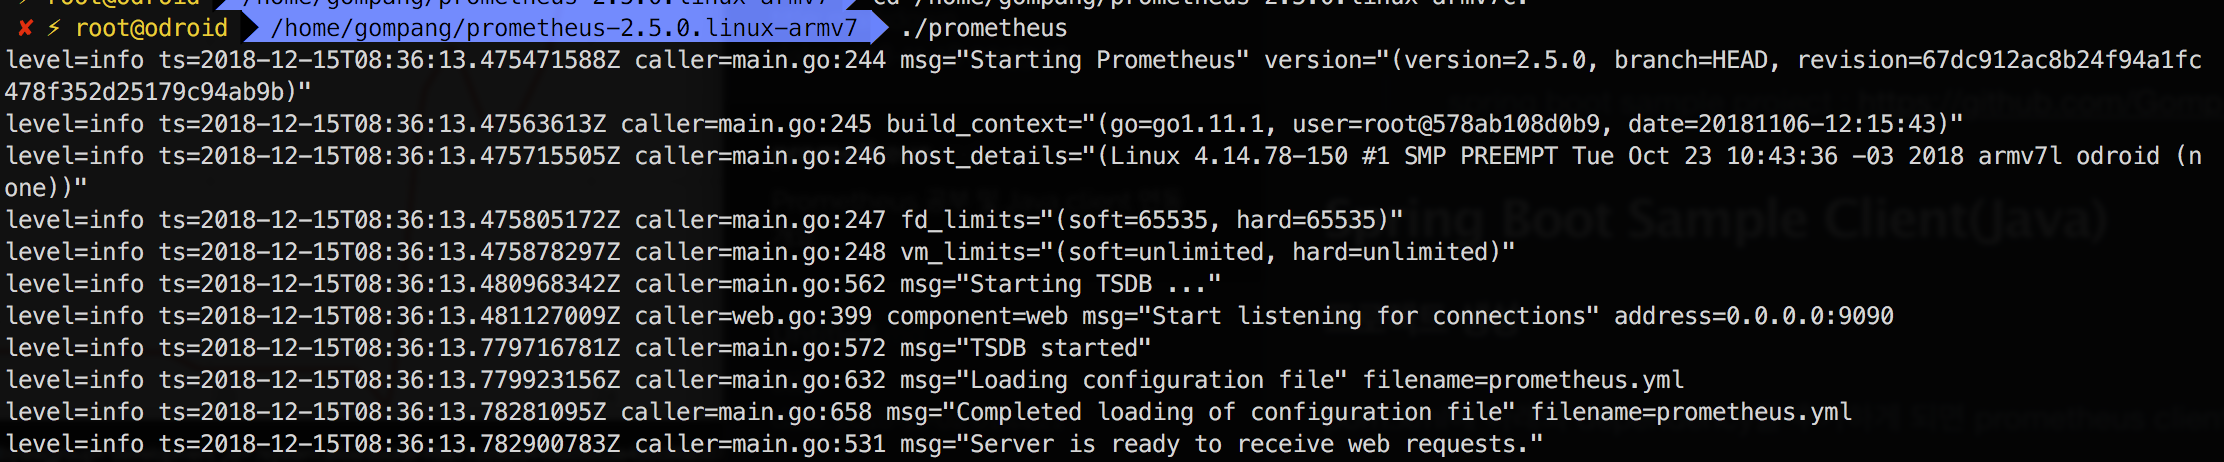
서버가 잘 실행이 되면 위와 같이 Server is ready to receive web requests. 라는 메세지가 나오게 된다.
이제 메트릭을 수집하기 위해 sample client를 만들어봐야하는데, 간단하게 spring boot로 구성을 해서 띄워보도록 하겠다. 샘플 프로젝트는 github에 올려놨으니 보고 참고를 하면 좋을 것 같다.
spring boot sample project : https://github.com/Gompangs/prometheus-client-sample
Spring Boot Sample Client(Java)
프로젝트 생성
pom.xml에 아래의 dependency를 추가하게 되면 prometheus client가 추가가 되게 된다.
사실 이런 방식 말고 spring boot용 prometheus client가 존재를 해서 그걸 dependency로 가져오게 되면 훨씬 간단하게 바로 사용을 할 수 있는데, 어떻게 돌아가는지를 직접 보면서 metric을 export를 해보기 위해서 client 모듈을 직접 가져와서 사용해보도록 하자.
참고. Spring boot용 client는 actuator를 활용해서 구현이 되어 있다(https://www.callicoder.com/spring-boot-actuator-metrics-monitoring-dashboard-prometheus-grafana/) 를 참고하면 연동방법에 대해 나와 있다.
<!-- The client -->
<dependency>
  <groupId>io.prometheus</groupId>
  <artifactId>simpleclient</artifactId>
  <version>0.6.0</version>
</dependency>
<!-- Hotspot JVM metrics-->
<dependency>
  <groupId>io.prometheus</groupId>
  <artifactId>simpleclient_hotspot</artifactId>
  <version>0.6.0</version>
</dependency>
<!-- Exposition HTTPServer-->
<dependency>
  <groupId>io.prometheus</groupId>
  <artifactId>simpleclient_httpserver</artifactId>
  <version>0.6.0</version>
</dependency>
dependency를 추가하고, spring boot dependency를 추가하고나서 Java bean config쪽을 구성해보자
@Configuration
@Slf4j
public class PrometheusConfig {
    @PostConstruct
    public void init(){
        DefaultExports.initialize(); // Export JVM Metrics into http endpoint
    }

    @Bean
    public HTTPServer prometheusServer() throws IOException {
        log.info("promethues server has started");
        return new HTTPServer(9090);
    }
}
보면 그냥 configuration 클래스가 로딩될 때, DefaultExports로 initialize를 해주고, prometheus 서버를 띄워주는 역할만 하고 있다.
이렇게 구성해서 띄워보면, 실제로 9090포트로 prometheus metric exporter가 구동이 되게 된다. 접근해보면 아래와 같은 페이지가 나오게 된다
# HELP jvm_memory_bytes_used Used bytes of a given JVM memory area.
# TYPE jvm_memory_bytes_used gauge
jvm_memory_bytes_used{area="heap",} 8.0815512E7
jvm_memory_bytes_used{area="nonheap",} 4.3263472E7
# HELP jvm_memory_bytes_committed Committed (bytes) of a given JVM memory area.
# TYPE jvm_memory_bytes_committed gauge
jvm_memory_bytes_committed{area="heap",} 1.6777216E8
jvm_memory_bytes_committed{area="nonheap",} 4.5481984E7
# HELP jvm_memory_bytes_max Max (bytes) of a given JVM memory area.
# TYPE jvm_memory_bytes_max gauge
jvm_memory_bytes_max{area="heap",} 1.908932608E9
jvm_memory_bytes_max{area="nonheap",} -1.0
# HELP jvm_memory_bytes_init Initial bytes of a given JVM memory area.
# TYPE jvm_memory_bytes_init gauge
jvm_memory_bytes_init{area="heap",} 1.34217728E8
jvm_memory_bytes_init{area="nonheap",} 2555904.0
# HELP jvm_memory_pool_bytes_used Used bytes of a given JVM memory pool.
# TYPE jvm_memory_pool_bytes_used gauge
jvm_memory_pool_bytes_used{pool="Code Cache",} 7142976.0
jvm_memory_pool_bytes_used{pool="Metaspace",} 3.1820632E7
jvm_memory_pool_bytes_used{pool="Compressed Class Space",} 4299864.0
jvm_memory_pool_bytes_used{pool="PS Eden Space",} 5.7521336E7
jvm_memory_pool_bytes_used{pool="PS Survivor Space",} 8909040.0
jvm_memory_pool_bytes_used{pool="PS Old Gen",} 1.4385136E7
...
값을 보게 되면 JVM에 사용되는 메트릭에 대한 정보가 export되었다는 걸 알 수 있다
실제 DefaultExports.initialize(); 가 어떻게 구현되었는지를 보면 어떤 정보가 export되는지 볼 수 있는데
    public static synchronized void initialize() {
        if (!initialized) {
            (new StandardExports()).register();
            (new MemoryPoolsExports()).register();
            (new MemoryAllocationExports()).register();
            (new BufferPoolsExports()).register();
            (new GarbageCollectorExports()).register();
            (new ThreadExports()).register();
            (new ClassLoadingExports()).register();
            (new VersionInfoExports()).register();
            initialized = true;
        }

    }
메모리와 쓰레드, 그리고 GC등에 대한 정보를 가져와서 등록하는 부분이 있는걸 볼 수 있다.
이제 JVM에 관련된 메트릭 말고 실제 원하는 메트릭을 export를 해봐야 하는데, 그러기 위해서는 export를 할 수 있는 metric의 타입이 어떤것들이 있는지부터 알아보고 가야한다
상세 설명 및 정보는 공식 홈페이지에(https://prometheus.io/docs/concepts/metric_types/) 있다.
크게 4가지의 메트릭 타입이 존재한다.
Counter
값을 나타내는 메트릭인데, "증가"만 할 수 있는 메트릭이라고 보면 된다. 카운터는 값을 증감시키거나, 0으로 초기화해서 다시 시작하거나 하는 기능만 지원을 한다. 그렇기 때문에 좀 제한적인 부분에만 사용을 할 수 있을 것 같은데, 아래와 같은 경우에 사용이 가능하지 않을까 싶다.
- http total send bytes
- http total request
- running time
Gauge
게이지는 카운터와 개념은 같지만, 값이 "증감"하거나 "감소"할 수 있다. 따라서 하나의 값을 나타내는 경우에는 대부분 게이지를 사용을 해서 구현을 하면 될 것 같다.
- temperature
- current cpu usage
- current thread count
- ...
Histogram
특정 기간동안 측정된 값을 표현할 때 사용한다. 모든 메트릭 데이터의 합계를 제공하고 quantile을 계산(0.95, 0.99 ...) 할 수 있도록 지원한다.
- TPS(Transaction per second)
- 특정 기간동안의 집계나 API 콜 수 등을 보고싶을때
- bucket 단위로 quantile을 집계한다.
- default : .005, .01, .025, .05, .075, .1, .25, .5, .75, 1, 2.5, 5, 7.5, 10.
// 아래와 같이 특정 bucket에 해당하는 값을 집계한다
request_duration_bucket{le="0.005",} 0.0
request_duration_bucket{le="0.01",} 0.0
request_duration_bucket{le="0.025",} 0.0
request_duration_bucket{le="0.05",} 0.0
request_duration_bucket{le="0.075",} 0.0
request_duration_bucket{le="0.1",} 0.0
request_duration_bucket{le="0.25",} 0.0
request_duration_bucket{le="0.5",} 0.0
request_duration_bucket{le="0.75",} 0.0
request_duration_bucket{le="1.0",} 0.0
request_duration_bucket{le="2.5",} 0.0
request_duration_bucket{le="5.0",} 1.0
request_duration_bucket{le="7.5",} 1.0
request_duration_bucket{le="10.0",} 3.0
request_duration_bucket{le="+Inf",} 3.0
Summary
히스토그램과 비슷하지만, φ-quantiles을 지원한다는 점이 차이점이고 슬라이딩 시간단위의 윈도우를 계산할때 사용한다.
- Histogram과 동일하게 특정 기간동안의 집계나, Request duration, response size 등을 모니터링 하고자 할 때 유용하다.
// Histogram과의 차이점은, bucket에 메트릭을 담는것이 아닌
// count,sum을 제공하고, 등록한 quantile을(custom하게 여러개 생성할 수 있다) 사용한다는 점이다.
request_duration_summary{quantile="0.95",} 7.4632192
request_duration_summary_count 5.0
request_duration_summary_sum 27.338737899999998
Gauge 사용해보기
@RestController
@Slf4j
public class SampleController {
    private Gauge sampleGauge;

    @PostConstruct
    public void init() {
        sampleGauge = Gauge.build("sample", "sample metrics").register();
    }

    @GetMapping
    public String sample() {
        sampleGauge.inc();
        return "sample";
    }
}
Gauge를 사용해봤는데, 위와 같이 사용을 하면 된다. Gauge의 build를 통해서 메트릭의 이름을 지정해주고 이를 register(); 해주면 해당 메트릭이 등록이 되게 된다.
그리고 sample을 호출할때마다 sampleGauge의 값이 inc가 된다.
# HELP sample sample metrics
# TYPE sample gauge
sample 0.0
처음에 spring boot를 띄우게 되면 9090포트로 위와같은 메트릭이 export가 되게 되는데, localhost:8080으로 sample을 호출을 하게 되면 위의 sample값이 1.0 , 2.0 ... 와 같이 변하게 된다.
Counter.build("someCounter", "Some counter").register();Counter의 경우에도 위와같이 build -> register를 하게 되면 metric에 등록이 되게 된다.
간단한 gauge랑 counter의 경우는 위와같이 쓰면 되지만 실제로 많이 사용하게 될 메트릭들은 대부분 histogram과 summary일텐데 이건 공부가 좀더 필요해보인다. spring boot prometheus client(micrometer)를 기본으로 export하면 대부분 summary를 많이 사용하는 걸로 보인다(histogram은 안쓰고 summary만 씀)
Spring boot exporter
custom하게 metric을 export하는건 위에서 아주 살짝 맛만 봤는데, 실제로 잘 구현된 metric은 어떻게 구성되는지를 한번 알아보자. spring boot의 경우 actuator를 사용하면 별도의 설정없이 tomcat, jvm, spring에 관련된 정보를 export할 수 있다. (https://dzone.com/articles/monitoring-using-spring-boot-2-prometheus-and-graf)
<!-- Spring boot actuator to expose metrics endpoint -->
<dependency>
    <groupId>org.springframework.boot</groupId>
    <artifactId>spring-boot-starter-actuator</artifactId>
</dependency>
<!-- Micormeter core dependecy  -->
<dependency>
    <groupId>io.micrometer</groupId>
    <artifactId>micrometer-core</artifactId>
</dependency>
<!-- Micrometer Prometheus registry  -->
<dependency>
    <groupId>io.micrometer</groupId>
    <artifactId>micrometer-registry-prometheus</artifactId>
</dependency>
pom.xml에 위의 dependency를 import하고
#Metrics related configurations
management.endpoint.metrics.enabled=true
management.endpoints.web.exposure.include=*
management.endpoint.prometheus.enabled=true
management.metrics.export.prometheus.enabled=true
application.properties에 위와 같은 config를 넣어주게 되면 localhost:8080/actuator/prometheus로 metric이 export되게 된다
그리고 grafana에서 보여지게 될 tag를 붙여줘야 한다
@Configuration 클래스를 하나 만들어서 아래의 bean을 등록해주자
@Configuration
@Slf4j
public class PrometheusCustomConfig {
    @Bean
    MeterRegistryCustomizer<MeterRegistry> metricsCommonTags() {
        return registry -> registry.config().commonTags("application", "PROMETHEUS-SAMPLE-SERVER");
    }
}
이렇게 해야 grafana에서 여러개의 scrape target이 있을때 tag를 가지고 구분을 할 수 있게 된다.
# HELP http_server_requests_seconds
# TYPE http_server_requests_seconds summary
http_server_requests_seconds_count{exception="None",method="GET",outcome="SUCCESS",status="200",uri="/actuator/prometheus",} 1.0
http_server_requests_seconds_sum{exception="None",method="GET",outcome="SUCCESS",status="200",uri="/actuator/prometheus",} 0.083506614
http_server_requests_seconds_count{exception="None",method="GET",outcome="SUCCESS",status="200",uri="/",} 5.0
http_server_requests_seconds_sum{exception="None",method="GET",outcome="SUCCESS",status="200",uri="/",} 0.094335788
http_server_requests_seconds_count{exception="None",method="GET",outcome="SUCCESS",status="200",uri="/**/favicon.ico",} 4.0
http_server_requests_seconds_sum{exception="None",method="GET",outcome="SUCCESS",status="200",uri="/**/favicon.ico",} 0.042993164
http_server_requests_seconds_count{exception="None",method="GET",outcome="SUCCESS",status="200",uri="/actuator",} 1.0
http_server_requests_seconds_sum{exception="None",method="GET",outcome="SUCCESS",status="200",uri="/actuator",} 0.073100047
한 예로, http server의 RPS(Request per second)의 경우에 위와 같이 export를 해주는데, 보면 uri와 httpStatus, method 등을 나타내준다. 이를 시간별로 sum, count값을 보여주므로 그래프에 표현하게 되면 시간대별 HTTP 호출 그래프를 그릴 수 있다(Grafana)
Prometheus Server에 메트릭 수집하기
위 서버를 구동시켜두고(8080포트) prometheus에서 이 서버로의 metric을 수집해보도록 config파일을 바꿔보자(공유기 내부 네트워크라서 192.168.0.x 로 설정을 했지만, 실 서비스에서는 prometheus서버가 metric export를 하는 서버에 http(80)으로 접근이 가능해야 수집이 가능하다)
그리고 spring boot metric exporter를 사용하게 되면 scrape path가 달라져야 하는데, 기본으로는 host 주소를 적은 뒤 "/metrics"에서 긁어오지만 spring boot의 경우는 /actuator/prometheus에서 가져오기 때문에 아래와 같이 설정을 바꿔줘야 한다
# my global config
global:
  scrape_interval:     1s # Set the scrape interval to every 15 seconds. Default is every 1 minute.
  evaluation_interval: 1s # Evaluate rules every 15 seconds. The default is every 1 minute.
  # scrape_timeout is set to the global default (10s).

# Alertmanager configuration
alerting:
  alertmanagers:
  - static_configs:
    - targets:
      # - alertmanager:9093

# Load rules once and periodically evaluate them according to the global 'evaluation_interval'.
rule_files:
  # - "first_rules.yml"
  # - "second_rules.yml"

# A scrape configuration containing exactly one endpoint to scrape:
# Here it's Prometheus itself.
scrape_configs:
  # The job name is added as a label `job=<job_name>` to any timeseries scraped from this config.
  - job_name: 'prometeus-sample-server'
    # metrics_path defaults to '/metrics'
    # scheme defaults to 'http'.
    metrics_path: '/actuator/prometheus'
    static_configs:
            - targets: ['192.168.0.3:8080']
보면 scrape_configs에 metrics_path가 설정되었는데, 기본으로는 metrics지만 이를 actuator/prometheus로 변경해주는 부분이다. 이렇게 설정하고 잘 실행이 되면 prometheus dashboard를 가서 확인해보자
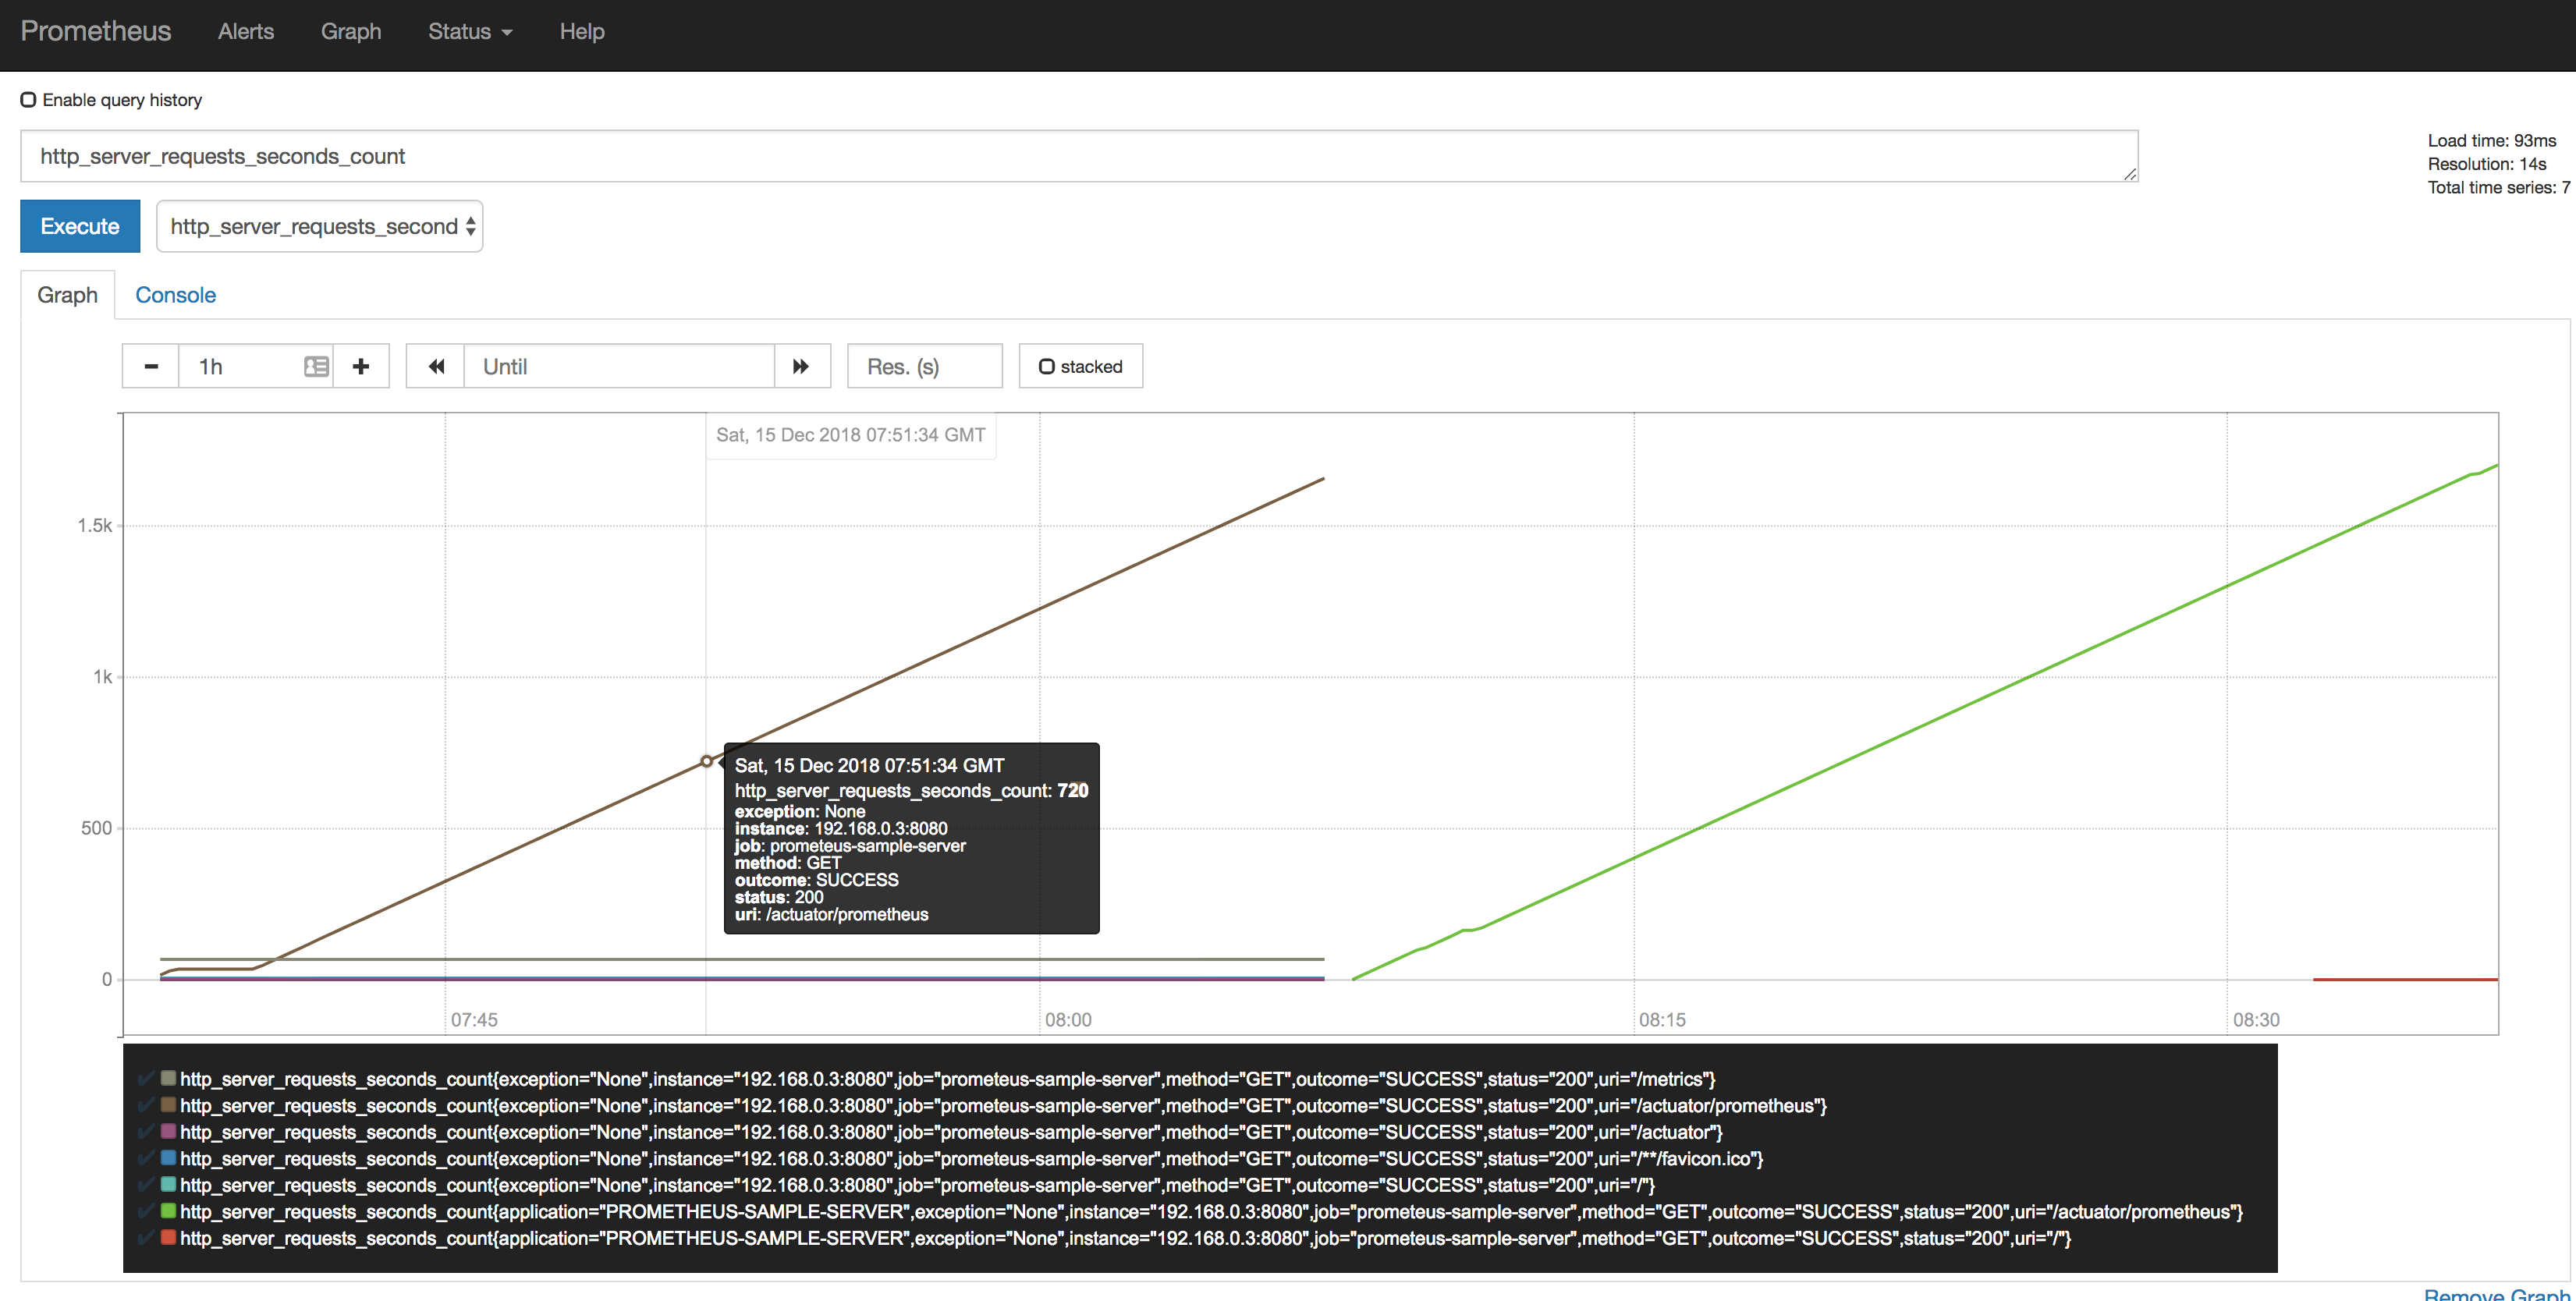
아무거나(http_server_requests_second를 골랐다) 선택해서 execute를 한 뒤 그래프를 확인해보면 위와같이 잘 나오는걸 알 수 있다.
Grafana에서 그래프 연동하기
사실 이부분은 손이 매우많이 가기도 하고 어려운 부분이지만, 다행히도 이를 간편화해서 대시보드를 만들어놓으신분들이 있으셔서 grafana 공식 홈페이지에서 이를 받아서 사용할 수 있다
http://docs.grafana.org/installation/debian/ 에서 다운로드를 받아서 서버에 설치하자

이런 훌륭한 대시보드를 미리 만들어뒀으니 갖다 써보자.
써보려고 하는 대시보드는JVM(Micrometer) 이다(https://grafana.com/dashboards/4701)
Datasource 등록하기 : http://docs.grafana.org/guides/getting_started/
Dashboard import하기 : http://docs.grafana.org/reference/export_import/
이 대시보드는 현재 Spring boot에서 내보내는 metric을 Prometheus 서버가 scrape해서 데이터를 가져왔고, 저장된 데이터를 기준으로 Grafana에서 보여주고 있는 것이다.
사실 간단한 연동이라고 해서 진행을 했지만 도중에 어려운 부분이 하나씩 있을테니 가이드를 보면서 차근차근 도전해보는게 좋다. 사실 Prometheus로 시작했지만, 끝 마무리는 Grafana로 맺게 되는데.. Grafana를 약식으로 소개해서 그렇지 이 하나만 가지고도 여러개의 포스팅이 나올 수 있을만큼 강력하고 간단한 오픈소스 대시보드 솔루션이다.
이렇게 구성을 해두면 서비스를 하면서 문제가 생길만한 포인트를 사전에 알아본다던지, 현재 문제가 발생하는 부분이 어디에서 나는지(어떤 API가 현재 몇 TPS, Response time은 괜찮은지) 에 대한 정보를 얻을 수 있게 된다.
아무래도 devOps같은걸 하다보면 실제 개발만 하고 끝나는게 아니라 운영과 모니터링을 해야 하는데 그런 부분에서 Prometheus와 Grafana는 이런 정보를 얻기에 정말 간편한 구조를 채택하고 있음이 분명하고, 잘 활용을 한다면 높은 SLA 를 유지하는데 도움이 될 것이다.